How to Set ATP Testing RLU Limits for Your Plant
octobre 05, 2026

What is an RLU?
RLU stands for relative light units, the number a luminometer reports after an ATP swab. ATP left on a surface reacts with an enzyme and gives off light, so more light means more organic residue left after cleaning. RLU scales differ between instruments and surfaces, which is why ATP testing RLU limits have to be set per facility, from your own data.
Why ATP Testing RLU Limits Must Be Site-Specific
One of the most important questions facilities implementing an ATP sanitation verification program face is how to establish effective thresholds. Establishing thresholds is not only relevant at the start of the program, but should be reevaluated at regular intervals to make sure the sanitation objectives reflect real-world conditions, which can change over time.
Rather than take the approach of setting the pass, marginal and fail thresholds at a manufacturer’s recommended levels, Neogen has looked at an ATP sanitation verification system as a way to determine what the current sanitation conditions are at a facility and to use thresholds as a way to gage improvements. The key is that they should be specific to each facility.
Step 1: How to Set ATP Limits, Starting with a Test Plan
The first step is to determine a test plan that accurately reflects a representative sampling of a cleaning event. Line one goes down and is cleaned. Which test sites do I need to sample to determine if the cleaning was effective? Once you have made that determination, it’s time to start the threshold setting process.
Step 2: Find Acceptable RLU Levels from Your Baseline
The pass threshold should represent the range of scores that would result from the successful completion of the cleaning process. In a wet clean and/or CIP scheme, the best way to make that determination is by monitoring your cleaning process to make sure it is followed correctly by performing a series of ATP measurements over several days or weeks to determine a representative sampling. At least six to 10 samples per test site will be necessary to determine the expected outcome. If a pattern is not established, continue sampling until enough evidence exists to make the determination.
Step 3: Turn the Performance Curve into an ATP Threshold
An analysis of the data at that point should result in a performance curve where pass, marginal and fail thresholds will be evident. An example of 10 test results for Conveyor Belt # 1 is included below:

This data would suggest that when proper cleaning protocols are followed, typical results would range in the 0 – 120 RLU range, as indicated from seven of the 10 results. The results from days one, four and seven indicate a failure in some aspect of the SSOP.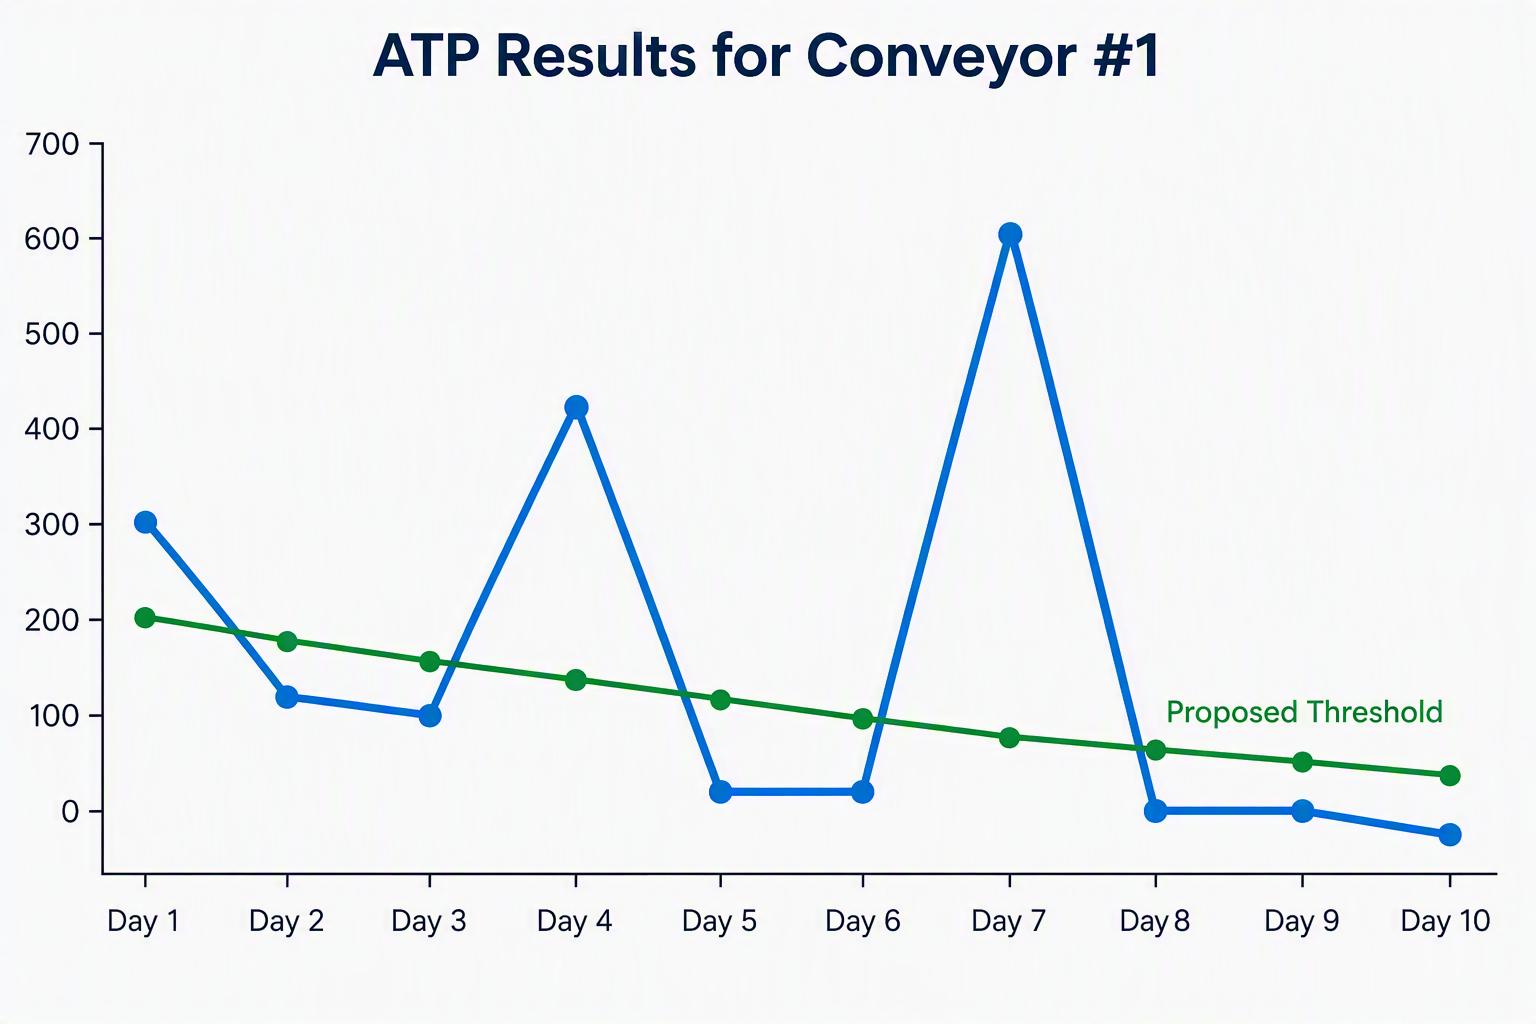
Example 2: Conveyor Chute #2
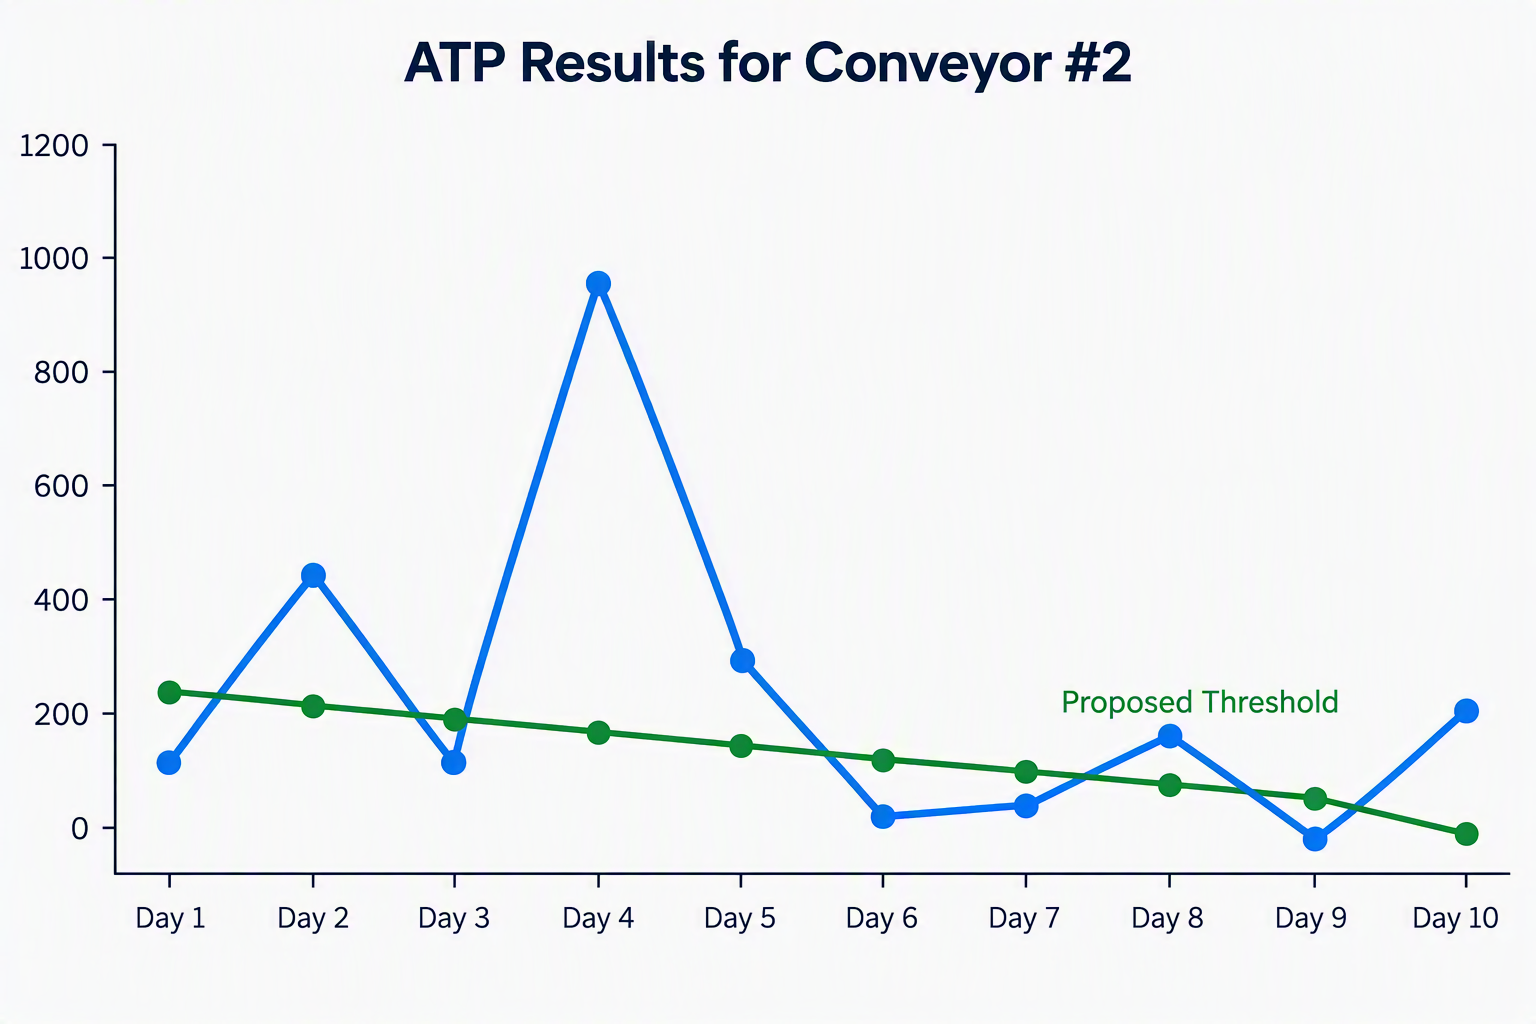
The example data below suggest a different interpretation of the cleaning process for another piece of equipment, Conveyor Chute #2:

In this example, five of the 10 samples resulted in a score of 125 or below. This gives some evidence to support a pass level of 125 RLU but also indicates a cleaning process that needs to be further investigated to understand the variation in results. In this case, more testing is needed after reviewing and monitoring the SSOP.
Keep Re-Evaluating Your ATP Limits
Once the pass, marginal and fail baselines are established, future process improvements can be evaluated relative to these standards.
In conjunction with NSF International, Neogen has developed an industry best practices guide to provide quality assurance managers, sanitarians and other hygiene/sanitation managers with simple, real-world best practices for implementing an ATP hygiene/sanitation monitoring program that delivers optimal results. For more information, download the ATP best practices guide.
Catégorie : Sécurité alimentaire